

2025 Phase 1 Clinical Trials, Pt. 2
- Andy V
- May 15, 2025
- 5 min read


In a prior post 2024 & 2025 FDA Phase 1 Submissions I took a brief look at the 2025 v 2024 relative location of the study for early phase 1 and phase 1 trials at the FDA during Q1. I sampled roughly 30% of all the trials in both years.
In this post, I am expanding this view to look at additional data. And while I kept the same sample size (300), I did -- so far -- limit it to 2025, given the review of the data was much more time-consuming than before. For this look, I broke down the following:
Location of the sponsor company/entity. Who is bringing this study forward?
The type of sponsor company. Is this a for-profit or not-for-profit (called 'university' in my data)? In almost every case, the not-for-profit was either a hospital or university.
What is the nature of the drug being studied:
NCE - small molecule not yet approved
NBE - large molecule not yet approved
Cell/Gene - a specific cell or gene therapy
Approved - a study looking at some aspect of an approved drug
505b2 - a study looking at an approved drug in a different modality. I further recognize that some of what I called approved drugs could be furthered as a 505b2 based on study results, but I drew the line a different modality only.
Natural - a plant based substance being studied
The rest are pretty self-explanatory
Right the 1st Time. I did look at how many filings met the FDA QC criteria upon filing vs. not. If it was not right the first time, I stated how many weeks it took to get RFT.
Last, the start dates are defined by the FDA as "The actual date on which the first participant was enrolled in a clinical study. The "estimated" study start date is the date that the researchers think will be the study start date."
First, the drug regulatory breakdown of the sample set of 300 early phase 1 and phase 1 drugs in Q1 at the FDA:

In Q1, small molecules had the highest share of studies at ~29%, followed by large molecules such as antibodies, ADC's and fusion proteins at ~25% in turn followed by cell/gene therapies, mostly CAR-T and NK cells at 20%. Quickly dropping off this were approved therapies mostly being studied by researchers at mostly non-profits with some post marketing studies done by for-profit sponsors. As a note, 'NA' refers to studies being done without a drug, perhaps using light therapy or sound or even AI chatbots. Undetermined means just that: there was insufficiency of information publicly (that I or CGPT) could find to make a call.
Next, were sponsor type. Who is bringing forth these studies?

Pretty clear. And where are these sponsors based?
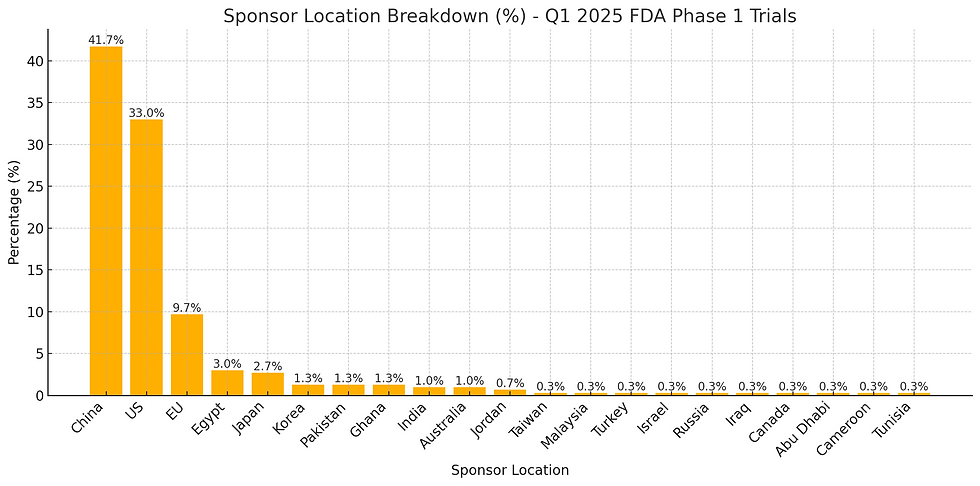
China leads all sponsor locales, landing at ~42% of all initiated studies at the FDA. Interestingly, a large segment of these are Universities and Hospitals. The breakdown of China type sponsors is below:
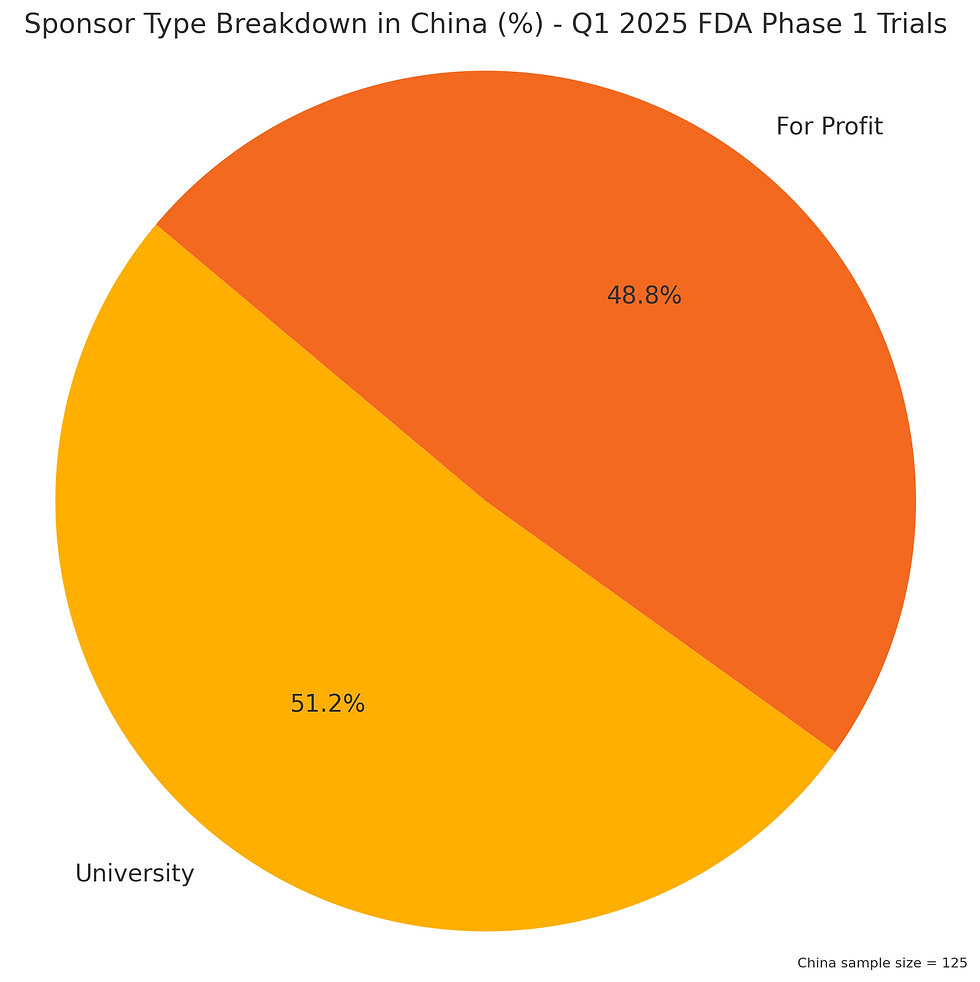
It would appear China has a very strong academic / research collaborative effort that reaches into practical clinical trials,. And what are the Chinese academic researchers investigating?

China academia, at least as far as early clinical studies goes, is dominantly in the Cell and Gene category. Not really even close. The equates to a total of 32 studies -- slightly over 10% of all clinical phase 1 trials started in Q1 (via my sample size) at the FDA were from China academia in the field of Cell and Gene.
Compare this with the US:

Perhaps not surprisingly there are many more 'for-profit' trials started vs academia, when compared against China. My initial thought is this is a natural outcome of access to capital of the 'for-profit' companies, but then I had to consider the (pre-DOGE) NIH funding where ~$37B was allocated across the 50 states to researchers in 2024. I think it is really interesting to ask why China academia is prolific in a singular direction vs. US. I can only speculate.
Whatever the reason, there are fewer US academia programs initiating clinical trials at the FDA vs China. And what are the US academia focusing on?

Just as biased China was toward Cell and Gene, US academia studies tilted to the same degree using prior approved products for research purposes.
It is interesting to see the focused Cell and Gene effort in China across researchers (32 studies) vs the fairly minimal footprint of it in the US (7). Why the disparity? I wonder how many US / EU based CDMOs trying to scale their CGT business are actively working on penetrating China?
In terms of modality, the phase 1 studies break down accordingly:

Oral and IV in a virtual dead heat for phase 1 modality breakdown. The oral, of course, dominated by the small molecule (though some interesting one-offs like recombinant vaccine for local delivery in oral) while the IV was just as skewed toward cell and gene, and more traditional biologics. Coming in third was the sub-Q category with GLP-1 peptides and others being initiated. Stragglers included topical, inhalation and ocular.
An interesting heat map breaks it down further:

A quick rabbit hole moment given my prior VP of Sales role at a US CDMO small molecule: If 38% of trials are oral, then given 1022 trials initiated in Q1, numerically there should be around 388 oral based studies in Q1. However, it is reasonable to assume very few of the China sponsored trials were available for US CDMO participation given they were almost all run in China and sourced locally (my assumption). Further, approved drug studies would have been sourced as such, rather than developed. So, if those assumptions hold, how many oral programs might have been outsourced? This leaves 62 of the sample size of 300, or extrapolating, 248 potential oral developable programs. However, a significant number of these were big pharma and more than a few where sponsors with credit worthiness was uncertain, and I am thinking their remains perhaps 100 - 150 oral programs in Q1 where a US/European CDMO was employed to do the work? Maybe less. Complete guesswork though.
Last, RFT broke down as the following:

For the delays, the average time to correct was the following:
Count: 138 trials
Mean: 3.17 weeks
Median (50%): 2.00 weeks
Min: 1 week
Max: 40 weeks
25th percentile: 1.00 week
75th percentile: 4.00 weeks
Standard deviation: 4.19 weeks
As I was compiling not RFT data, I was often amazed that some of the most complex programs got it right from a QC point, and other simpler ones did not hit the RFT metric. I wouldn't hazard to guess why -- as I do not know this process at all. I suppose it is comforting that an ex-US company doing complex protocols for CGT or biologics can get it right the first time pretty often.
Last, and not too surprising, there was a worsening on RFT coming from academia vs for profits:

In Summary:
🧪 1. Submission Quality Is Split Evenly
138 trials were Right First Time (RFT = 'y'), and 138 were not (RFT = 'n').
Another 24 did not use active drugs and were not considered in RFT scoring.
Time to correct errors averaged 3.2 weeks, with a range from 1 to 40 weeks.
🌍 2. Regional Insights
China and the US were the dominant contributors:
China led in total trial volume, largely from university sponsors conducting cell/gene therapy studies.
The US showed a more balanced mix of sponsor types and trial modalities.
China and EU had strong RFT performance.
US trials were evenly split on RFT status.
🏛️ 3. Sponsor Type Trends
For-profit sponsors dominated in oral modalities and NCE regulatory pathways.
Universities focused more on IV and cell/gene work, particularly in China.
RFT performance was mixed across sponsor types, without a clear leader.
💊 4. Drug and Modality Profiles
The most common drug categories were NCE and cell/gene therapies.
Oral was the most frequent modality, especially for for-profit sponsors in the US.
Chinese universities were highly concentrated in cell/gene studies, while US universities were more diversified but lower in volume.
This is incredibly informative. I joined the University of Kansas IAMI team which is an imbedded pharmaceutical company moving university discoveries onto the market with the help of a public-private partnership Gallery 3 — BioNovus We are academic but with industry expertise focusing on Phase 1 enabling studies. Right now, we are 2/3 NCE, 1/3 cell/gene, and dipping our toes in radiopharma. We got first patient in for a CAR-T therapy 2 weeks ago. It's exciting to be on the frontend of the market and see the distribution of effort for each modality.